PATENT-PENDING MEMORY ORCHESTRATION

Make more of the memory you already own.

MemoryPulse helps infrastructure operators identify useful memory headroom, qualify it against customer-defined performance requirements, and manage eligible state with verified restoration. The opportunity is measured on your workloads—not assumed from ours.

Software-based deploymentModern and legacy infrastructureCustomer-controlled SLOs
QUALIFIED NVIDIA B200 WORKLOADPUBLISHED EVIDENCE
4.33×
baseline-to-managedresident-memory footprint ratio
Before3.491 GB
With MemoryPulse0.806 GB
76.9% less resident memoryMeasured in this controlled workload
Memory-footprint ratio, not a claim of 4.33× throughput or fewer servers.
SELECTED CONTROLLED QUALIFICATIONS View evidence
4.33×B200 footprint ratio
79.94%24-hour sustained net reduction
1.08 ms24-hour workload p99
94.18%Redis logical-use reduction

Results from separate qualification runs. Not a guarantee of savings, throughput, fleet consolidation, or identical performance in every environment.

INFRASTRUCTURE VALUE

See the technical proof. Make the business case.

Less qualified resident memory can create headroom for deployment decisions. A customer pilot establishes whether that headroom improves your actual capacity, cost profile, and performance obligations.

Explore the enterprise ROI model
01 / CAPACITY

Free useful headroom

See how much workload-specific memory remains avoided after reaccess and verified restoration—not just gross release totals.

02 / INVESTMENT

Defer expansion where qualified

Where memory limits workload placement, qualified capacity may postpone purchases or extend the useful life of existing equipment.

03 / OPERATIONS

Evaluate the full footprint

Use your measured workload results to model potential rack, power, cooling, and floor-space implications without assuming direct one-for-one savings.

YOUR INFRASTRUCTURE · YOUR SLOs

Observe. Discover. Qualify. Manage—with authorization.

Start read-only. Understand the estate and its eligible state. Demonstrate sustained performance and verified restoration before any approved Managed operation.

Discuss a paid qualification
CAPACITY SCENARIO · ILLUSTRATIVE ONLY

What could a qualified reduction mean at your scale?

Move the baseline to explore the arithmetic behind the separately measured 79.94% sustained net reduction. This is an example, not a forecast or an automatic hardware-equivalence calculation.

Modeled net memory avoided799.4 GB
Modeled memory remaining200.6 GB
Build a cost case with your real infrastructure

B200 (76.9% resident reduction), 24-hour Managed (79.94% sustained net reduction), and Redis (94.18% logical memory-use reduction) are distinct controlled studies. They must not be summed or applied universally. Memory savings alone do not establish GPU throughput gains, physical servers eliminated, or energy savings.

EXPLORE THE PLATFORM

The command center. In motion.

Explore the MemoryPulse RackOps dashboard layout with a self-running, browser-only demonstration. Data moves like operational telemetry, but every value is synthetic. No controller, customer system, or proprietary engine is connected.

SIMULATED · READ-ONLYLive-style experience, not live infrastructure
MEMORYPULSE
Enterprise Memory Command Center · Orchestration, Proof & Capacity Intelligence
Settings
RUNNING DEMO · SYNTHETIC
Device time · demo
COMMAND SCOPE
1 demo host1 / 1
Public demonstration · no customer connection
Demo node1 DEMO
Managed Cycle4 / 4 demo
Simulated requests / cycle5,000,000
Errors0 simulated
SnapshotSTATIC SAMPLE
Evidence SourceDEMO / NOT LIVE
PUBLIC DEMONSTRATION · MEMORYPULSE DASHBOARD PREVIEW

24-hour reference profile · 79.94% net reduction · 1.08 ms published workload p99

20M simulated requests total (5M per cycle)4 illustrative Managed cycles0 simulated integrity failures81.0% peak hot-pool reduction2.36 ms example restore p991.08 ms published 24h workload p99
DEMO
Qualification state
ANIMATED TELEMETRY • 100% SYNTHETIC

Watch the memory estate respond in real time

This is a browser-only simulation modeled around the 24-hour qualification ratio. The figures below change together and are not live data or additional measured results.


RUNNING SIMULATION
Net hot-memory reduction79.94%3.909 GiB avoided · simulated
Active working set1,004.6 MiB4.89 GiB synthetic baseline
Request latency p991.08 msIllustrative request telemetry
Restore latency p992.36 msIllustrative demand reconstruction
Illustrative throughput7,250/sSimulated requests per second
Safety integrity0Simulated failures · no controller
Changing memory footprintLast 40 synthetic observations · 00:00 elapsed
Active memory (MiB)Net avoided (MiB)
Trend-only overlay · independent vertical scales: active 900–1,140 MiB; avoided 3,750–4,240 MiB.
Illustrative activity1 sample
  1. Simulated workload established. No controller connected.
Source: Local deterministic demo model with small synthetic workload variations.Reference: Published 24h result: 79.94% sustained net and 1.08 ms request p99. These published metrics never fluctuate here.Boundary: No backend requests, private controller APIs, credentials or customer data.
Qualified B200 Footprint Ratio
4.33×
3.491 GB baseline ÷ 0.806 GB managed · separate qualified run; not 4.33× throughput
Sample Peak Hot-Pool Reduction
81.0%
Static 24h-style example · animation shown separately
Sample Gross Release
3.96 GiB
50.6 MiB restored · 3.91 GiB current net
Simulated Restore p99
2.36 ms
Animated synthetic demand restoration p99 · no universal SLO
Protected State
PASS
Illustrative protection design · no live authority
Additional Qualified Opportunity
Not estimated
Further savings require customer-specific qualification
Additional Evidence-Weighted Opportunity
Pending
No additional supported upside beyond conservative yet
Separate Discovery Sample
5.36 GiB
Workload-mapped bytes in separate 5.82 GiB illustrative estate; not physical savings
Simulated Current Net Hot Reduction
3.91 GiB
Animated synthetic profile; the frozen four-cycle story below is separate
Simulated Request Latency p99
1.08 ms
Animated synthetic request p99 · historical qualified p99 1.08 ms is separate
Discovery Proof
120 / 120
Synthetic discovery example; not authenticated live evidence
Sample Integrity Failures
0
Simulated status, not live qualification
Sample Thermal Condition
DEMO ONLY
No live temperature sensor or measured thermal claim
GPU Physical VRAM Return
Not detected
Not measured here; requires a connected, qualified GPU environment
GPU Reconstruction p99
Not detected
No GPU connected in this public demonstration
The Managed Release StoryWhat was hot, what MemoryPulse released, and what demand rebuilt
SYNTHETIC DEMO
Managed baseline4.89 GiBHot Redis memory before authorization
→
Immediately after release954 MiB3.958 GiB cumulative gross release in the example · 81.0% of 4.89 GiB hot pool
→
Demand restoration50.6 MiB108 simulated object restores · 50.6 MiB modeled restoration · 2.36 ms example p99
→
Current hot footprint1,005 MiB1,004.6 MiB active footprint · 3.909 GiB net avoided · 79.94% of 4.89 GiB example baseline
4.89 GiB
954 MiB
1,005 MiB
Why This MattersExecutive proof without overstating projections
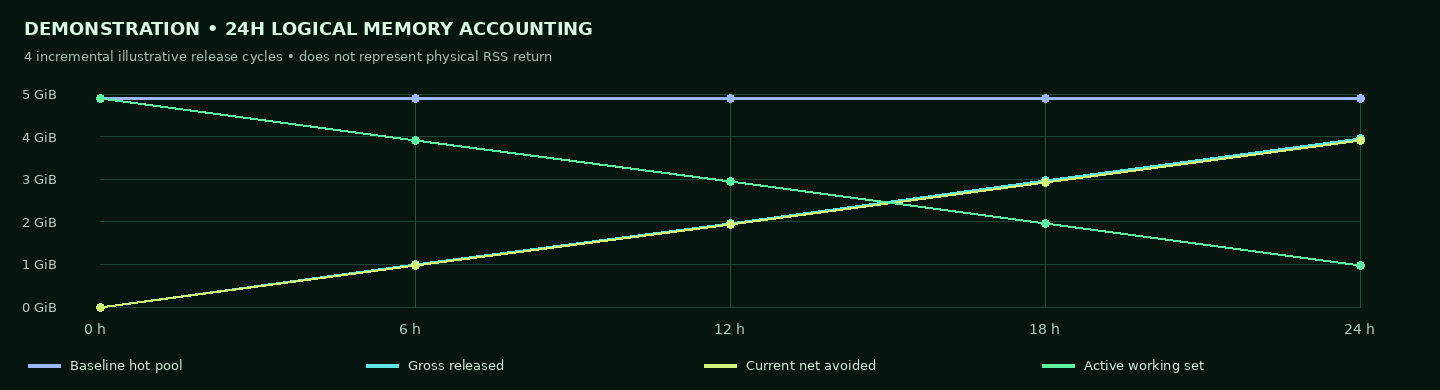
How the sample is calculatedIllustrative starting hot pool: 4.89 GiB. After release: 954 MiB. Gross released: 3.958 GiB (cumulative across four example cycles).
Sustained headroom, not gross churnAdding 50.6 MiB of sample reaccess produces a 1,004.6 MiB working set; 3.909 GiB remains avoided, or 79.94% of the illustrated baseline.
Restore must qualifyThe 2.36 ms restore p99 is a demonstration value, not a published qualification measurement. Authorized production releases require verified restoration and customer SLO compliance.
Correctness before optimizationThe demo depicts zero integrity failures, but this is not independent proof of a real customer deployment or of production readiness.
Published 24-hour proofThe separate qualified 24-hour run reported 79.94% final sustained net reduction, 1.08 ms managed-workload p99 and 4.20 GB cumulative released over four cycles. Those figures are not outputs from this demo host.
Buyer outcome to validateQualify useful sustained memory headroom under the buyer’s own SLOs, then calculate potential capacity, capex, power and cooling benefits from measured bottlenecks.
Capacity OutcomeSample gross release; further opportunity not established
Synthetic example: 4.89 GiB baseline, 3.958 GiB gross release, 3.909 GiB net avoided, 1,004.6 MiB active
Latency Against SLOLower is better; unavailable metrics remain pending
Published 24-hour workload p99 1.08 ms, separately illustrated Observe 3.07, post-rebuild 1.11, restore 2.36 milliseconds
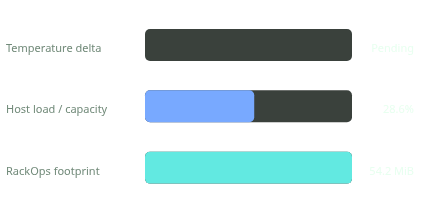
Thermal & OverheadTemperature delta, load, and RackOps footprint
thermal Chart · reference demonstration chart
Degree-level sensor not active. Host load is not MemoryPulse CPU overhead; qualification coordination and RackOps are reported separately in Engineering.
Memory IntelligenceExample 4.89 GiB hot pool: sustained net avoided versus working set
DEMO NET / ACTIVE
Current active footprint (20.06%)1,004.6 MiB
Current net avoided (79.94%)3.909 GiB
Further qualified opportunityNot estimated
Observe-to-Managed Capacity ModelNo additional savings estimate is asserted without separate customer evidence
UNASSESSED
Conservative potentialNot estimated—No additional release beyond the modeled canary is evidenced here
Additional evidence-weightedNot estimated—Requires further mapping and customer qualification
Evidence-weighted totalNot estimated—An upper bound cannot be inferred from this demonstration
Truth boundary: Unknown and active-resolution state remain protected and are not included in potential. Actual Managed release, reconstruction, latency and physical memory return must be measured separately.
Executive SummaryReconciled arithmetic · public sample and published evidence clearly separated
PUBLIC DEMONSTRATION, NOT LIVE TELEMETRY. In this consistent illustrative 24-hour profile, a 4.89 GiB hot-memory baseline (5,007.36 MiB) declines to 954 MiB after four sample release cycles. Gross released across those cycles totals 4,053.36 MiB (3.958 GiB). A synthetic 50.6 MiB is subsequently restored, leaving 1,004.6 MiB active and 4,002.76 MiB (3.909 GiB) of sustained net reduction. Thus 4,002.76 ÷ 5,007.36 = 79.94% avoided. The separate published 24-hour qualification reported 79.94% sustained net reduction and 1.08 ms managed-workload p99, with 4.20 GB cumulative released; the published cumulative-release figure is NOT this example’s net. Example restore p99 (2.36 ms), request counts (20 million), integrity status and discovery activity are SYNTHETIC. Per-workload savings, physical memory return and hardware consolidation require validation in the buyer’s own environment.
E1 INTELLIGENCE SUMMARYExecutiveC-suite business case · real estate results · conservative opportunity · technical ceiling
STATIC REFERENCE
ControllerDEMO / OFFLINE
DiscoverySTALE
ObserveOFFLINE DEMONSTRATION
AuthorizationPUBLIC DEMO · NO PRODUCTION AUTHORITY
Managed evidenceUNAVAILABLE
Last cycleDEMO DATA

Managed qualification reference

Public demonstration based on the separately published 24-hour qualification scale

Sustained net reduction79.94%Historical 24-hour qualification
Managed workload latency1.08 msHistorical p99
Demonstration host1Unconnected sample
Production authorizationDisabledPublic display only

Deployment value

Optimize useful memory headroom subject to customer-defined latency, correctness and restoration requirements.

Potential outcomeMore capacity from qualified infrastructure
Measurement standardEnvironment-specific qualification
Customer economic modelRequires site inputs and verified measurements